

Infographics Playbook by MorningAI


Great infographics do more than display data. They tell stories, simplify complex ideas, and make abstract concepts instantly understandable. Whether you're breaking down a multi-step process, comparing product features, or sharing best practices, visual communication beats walls of text every time. That's why MorningAI's new infographics feature exists: to transform any concept into compelling visuals that stick with your audience.
No more wrestling with design software or waiting on creative teams. With simple prompts, you can generate professional infographics that communicate your message clearly and persuasively.
What You'll Create (And Why It Matters)
MorningAI's infographics feature handles the heavy lifting of visual design while you focus on your message. Perfect for:
- Process guides that walk customers through complex workflows
- Best practices that turn expertise into shareable knowledge
- Product comparisons that highlight your competitive advantages
- Educational content that simplifies technical concepts
- Timeline visualizations for project updates or company milestones
- Tip sheets that organize actionable advice
- Performance metrics when data storytelling is needed
Step-by-Step: Creating Your First Infographic
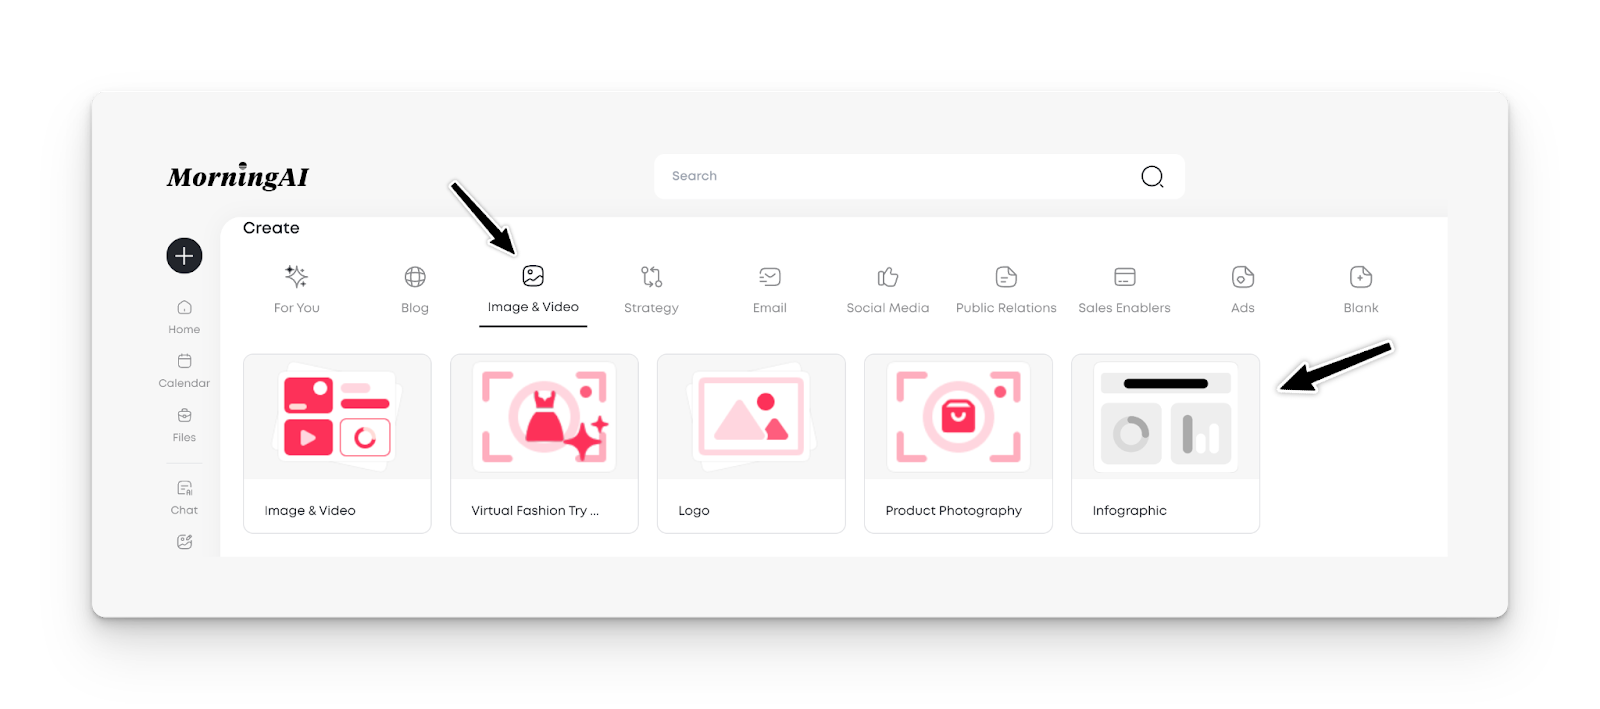
1. Access the Feature
Navigate to Image and Video in your MorningAI dashboard. You'll find Infographic on the far right of the options.
2. Write Your Prompt
Keep it simple and specific. The AI handles design complexity, so focus on your core message:
- Process Guide: "Create an infographic showing 5 steps for onboarding new remote employees"
- Best Practices: "Create an infographic with 7 tips for effective email marketing"
- Comparison: "Create an infographic comparing our product's battery life (8 hours) vs competitor's (5 hours)"
- Education: "Create an infographic explaining the customer journey from awareness to purchase"
- Performance: "Create an infographic showing sales are up 12% year to date"
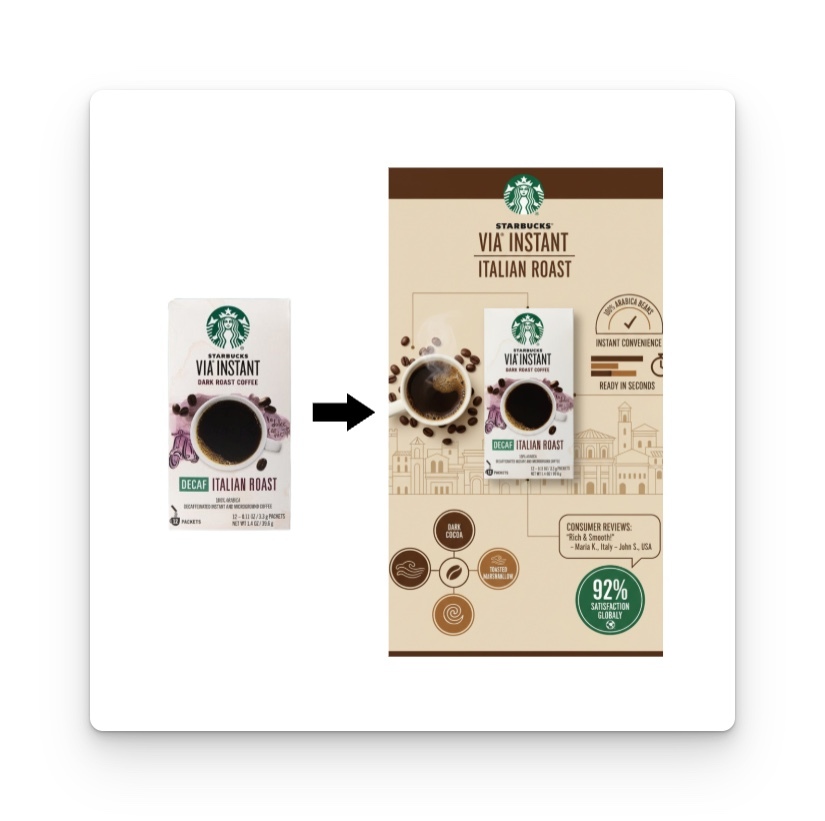
3. Generate and Review
Click Generate and wait a few seconds. The AI will create a square-format infographic with:
- Relevant visual elements tied to your brand
- Professional typography and layout
- Data visualization that supports your message
4. Edit and Refine
Click the generated image to access editing tools.
You can:
- Remove or modify text elements
- Adjust colors to match your brand
- Resize for different platforms
- Export in your preferred format
Real-World Use Cases
Scenario 1: Customer Education Instead of a lengthy FAQ, create an infographic that visually explains "How to Get Started with Our Platform in 5 Steps," complete with icons and clear progression.
Scenario 2: Internal Training Transform your employee handbook's "Meeting Best Practices" into a shareable infographic that actually gets referenced and followed.
Scenario 3: Thought Leadership Turn industry insights into educational infographics like "The Evolution of Remote Work: 2020-2024" that position your company as a knowledge leader.
Scenario 4: Product Marketing Use your loaded product catalog to generate comparison infographics between your offerings and competitors, highlighting key differentiators beyond just specs.
Pro Tips for Better Results
Think Beyond Statistics: The most engaging infographics often focus on processes, tips, or step-by-step guides rather than raw data. Consider what your audience needs to understand or do, not just what numbers you want to share.
Use Your Product Catalog Strategically: Since MorningAI already has your product information loaded, you can create educational infographics about how to use your products, not just compare them.
Review Text Accuracy: While the AI generates 90-95% accurate text, always double-check key information, especially for instructional content where accuracy is critical.
Consider the Full Journey: After creating your infographic, think about animating it using MorningAI's video tools, or creating a series that builds on each concept.
Current Limitations (And What's Coming)
Right now, infographics generate in square and vertical format only. You can resize them during editing. More format options are coming soon.
The text generation is highly accurate but not perfect. Always review and use the edit function to make adjustments as needed.
FAQ
Can I use these infographics commercially? Yes, these are designed for both internal use and external marketing, including social media and presentations.
What if I need a different aspect ratio for LinkedIn vs Instagram? Generate in the default square format, then use the editing tools to resize for your specific platform needs.
Can I create infographics for training or educational purposes? Absolutely. Process guides, best practices, and instructional content often work better as infographics than traditional documentation.
How detailed should my step-by-step processes be? Include 3-7 steps for optimal readability. If you have more steps, consider breaking them into multiple related infographics.
Can I create infographics that don't include any numbers or data? Yes! Some of the most effective infographics focus on concepts, processes, tips, or qualitative comparisons without any statistical data.
Your Next Step
Ready to transform your next concept into a visual story? Start with something your audience needs to understand or do, not just numbers you want to share. Try creating an infographic that explains a process, shares best practices, or breaks down a complex concept into digestible steps.
Think beyond the spreadsheet; your most valuable knowledge often lives in processes, methodologies, and insights that deserve visual treatment.
The coffee hasn't finished brewing on this feature yet; we're constantly improving the formats and capabilities based on user feedback.


